Plane Wave Polarization
The electric field phasor of a plane wave propagating in the $+z$ direction is
\begin{aligned}
\vec{E} &= \vec{E}_0 \mathrm{e}^{-jkz}\\
&= \left(\hat{x}E_{x0} + \hat{y}E_{y0}\right)\mathrm{e}^{-jkz}
\end{aligned}
where $E_{x0}$ and $E_{y0}$ are in general complex, i.e.,
\begin{aligned}
E_{x0} &= |E_{x0}|\mathrm{e}^{j\delta_x} \\
E_{y0} &= |E_{y0}|\mathrm{e}^{j\delta_y}
\end{aligned}
such that
\begin{aligned} \vec{E} &= \left(\hat{x}|E_{x0}|\mathrm{e}^{j\delta_x} + \hat{y}|E_{y0}|\mathrm{e}^{j\delta_y}\right)\mathrm{e}^{-jkz}\\
&= |E_{x0}|\mathrm{e}^{j\delta_x}\left(\hat{x} + \hat{y}\frac{|E_{y0}|}{|E_{x0}|}\mathrm{e}^{j(\delta_y-\delta_x)}\right)\mathrm{e}^{-jkz}\\
&= |E_{x0}|\mathrm{e}^{j\delta_x}\left(\hat{x} + \hat{y}\tan\psi\,\mathrm{e}^{j\delta}\right)\mathrm{e}^{-jkz},\\
\end{aligned}
where
\begin{aligned}
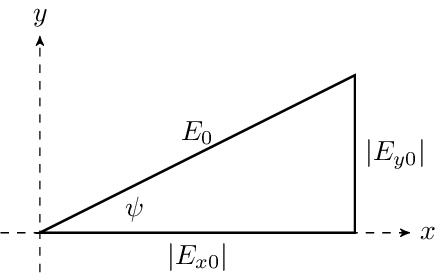
\tan\psi &= \frac{|E_{y0}|}{|E_{x0}|} \text{ (ratio of the amplitude of the y-component to the x-component)} \\
\delta &= \delta_y-\delta_x \text{ (phase of the y-component relative to the x-component)}
\end{aligned}
with
\begin{aligned}
0 \le \psi \le \pi \\
-\pi \lt \delta \le \pi.
\end{aligned}
The angle, $\psi$, can be understood graphically as
Special Cases
- Linear Polarization: $\psi = 0^{\circ} \text{ or } 90^{\circ}$, OR $\delta = 0^{\circ} \text{ or } 180^{\circ}$
- Circular Polarization: $\psi = 45^{\circ}$ AND $\delta = \pm90^{\circ}$